
71% of employed men and 79% of employed women reported that their job situation had changed as a result of the pandemic. Changes were primarily related to increased time in the home office (49% of women, 60% of men), fewer hours worked (27% of women, 36% of men), job closure (19% of women, 8% of men), leave of absence (9% of women, 7% of men), but also increased hours worked (11% of women, 18% of men).
At the beginning of the pandemic (April-May), men tended to spend more time outside the home than women. On average, man spent 16 hours per week away from home, including 8 hours for work, 5 hours for leisure, and 3 hours for other activities such as shopping. Women spent an average of 10 hours per week outside home, including 5 hours for work, 3 hours for leisure, and 2 hours for other activities.
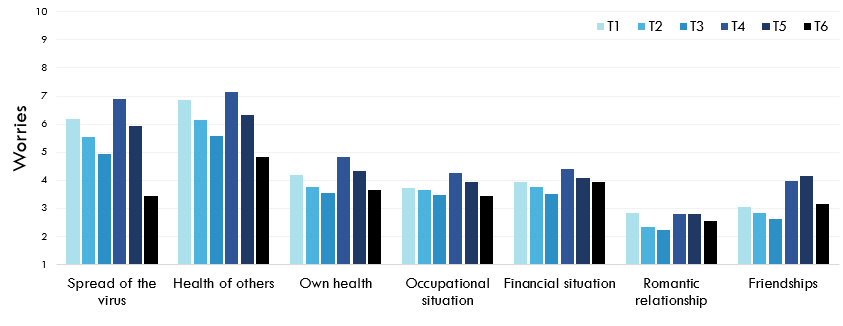
Pandemic-related concerns were surveyed using six different domains on a scale from 1 (not at all concerned) to 10 (very concerned). The figure shows that participants were primarily concerned about the health of others and the spread of the virus. They were less concerned about their own health, work, financial aspects, social contacts and friendships, and their partnership. Worries tended to decrease at the beginning of the pandemic, were slightly higher again between November 2020 and March 2021, and were rather low in March 2022.
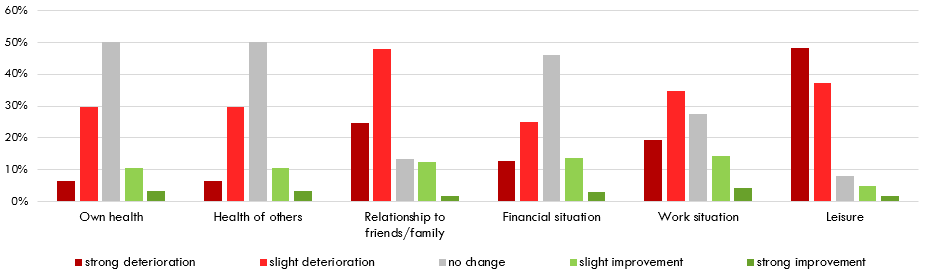
In November 2020, we asked participants about the impact the pandemic has had on their lives so far. With regard to their own health, the health of significant others and the financial situation, participants most frequently reported that there had been no changes due to the pandemic. In the areas leisure time, relationships with family/friends and work situation, on the other hand, mainly negative changes were reported. Positive changes occurred only among a few participants, although as many as 10 percent of people reported positive changes in all areas (except leisure).
In November 2020, participants were asked whether their relationship has improved or declined throughout the pandemic and which factors affected these changes.
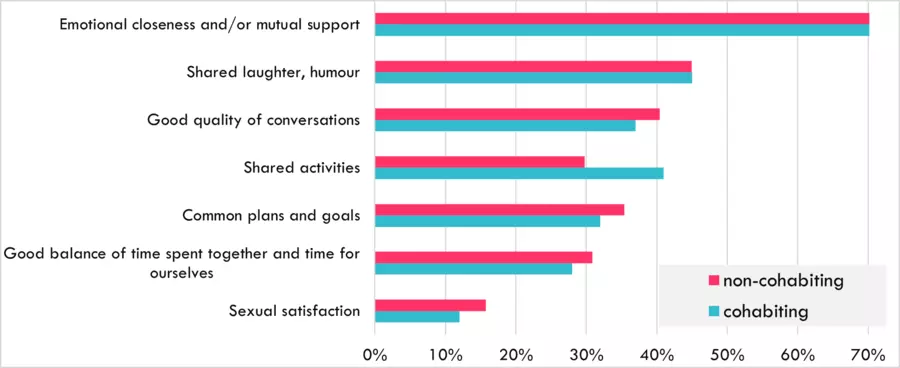
The graph below shows the categories that participants mentioned most frequently in terms of an overall improvement in relationship satisfaction during the first six months of the pandemic. It can be observed that especially emotional closeness, laughter/humor as well as a good quality of conversation contributed to the relationship becoming better during the pandemic. Cohabitants more frequently reported the positive effect of joint activities, non-cohabitants the importance of emotional closeness.
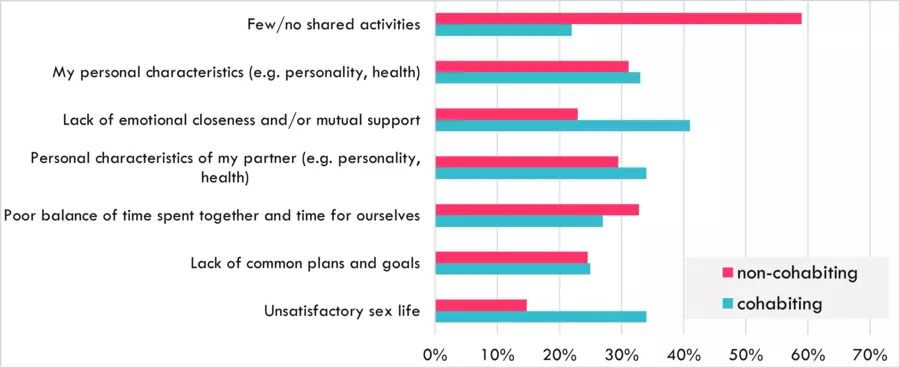
The graph above shows the categories mentioned by cohabitants and non-cohabitants in November 2020 in connection with a deterioration of the relationship.
It can be seen that the reasons for deterioration differ greatly between cohabitants and non-cohabitants. For non-cohabitants, lack of joint activities and poor balance of joint/separate time play a particular role. Cohabitants more often reported a lack of emotional closeness, unsatisfactory sex life or problematic personality traits of themselves and their partner.
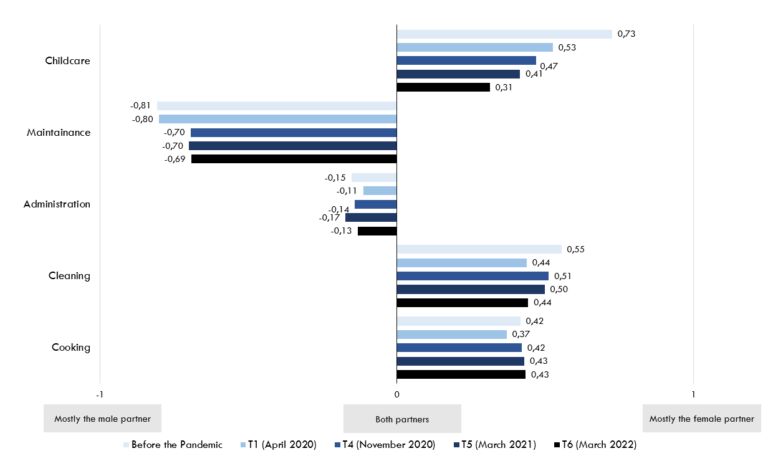
When considering participants who lived together with their partners, we also examined whether the division of housework and childcare had changed during the pandemic. As the graph below shows, there were overall small changes over time, which mainly affected the division of childcare, maintenance, as well as cleaning. Interestingly, on average, the division evolved toward more shared responsibility. For this graph, we only included participants who took part in all six measurement points (n = 325).